Tutorial
Time Series 01: Why Metadata Are Important: How to Work with Metadata in Text & EML Format
Last Updated: Apr 8, 2021
This tutorial covers what metadata are, and why we need to work with metadata. It covers the 3 most common metadata formats: text file format, web page format and Ecological Metadata Language (EML).
R Skill Level: Introduction - you've got the basics of R down and understand the general structure of tabular data.
Learning Objectives
After completing this tutorial, you will be able to:
- Import a .csv file and examine the structure of the related R object.
- Use a metadata file to better understand the content of a dataset.
- Explain the importance of including metadata details in your R script.
- Describe what an EML file is.
Things You’ll Need To Complete This Tutorial
You will need the most current version of R and, preferably, RStudio loaded on your computer to complete this tutorial.
Install R Packages
When presented in a workshop, the EML package will be presented as a
demonstration!
If completing EML portion of tutorial on your own, you must
install EML directly from GitHub (the package is in development and is not
yet on CRAN). You will need to install devtools to do this.
-
ggmap:
install.packages("ggmap") -
tmaptools:
install.packages("tmaptools") -
devtools:
install.packages("devtools");library(devtools) -
EML: **must be installed AFTER
devtoolsis loaded in R.install_github("ropensci/EML", build=FALSE, dependencies=c("DEPENDS", "IMPORTS"))
Download Data
The data used in this lesson were collected at the National Ecological Observatory Network's Harvard Forest field site. These data are proxy data for what will be available for 30 years on the for the Harvard Forest and other field sites located across the United States.
Set Working Directory: This lesson assumes that you have set your working directory to the location of the downloaded and unzipped data subsets.
An overview of setting the working directory in R can be found here.
R Script & Challenge Code: NEON data lessons often contain challenges that reinforce learned skills. If available, the code for challenge solutions is found in the downloadable R script of the entire lesson, available in the footer of each lesson page.
Understand Our Data
In order to work with any data, we need to understand three things about the data:
- Structure
- Format
- Processing methods
If the data are collected by other people and organizations, we might also need further information about:
- What metrics are included in the dataset
- The units those metrics were stored in
- Explanation of where the metrics are stored in the data and what they are "called" (e.g. what are the column names in a spreadsheet)
- The time range that it covers
- The spatial extent that the data covers
The above information, and more are stored in metadata - data about the data. Metadata is information that describes a dataset and is integral to working with external data (data that we did not collect ourselves).
Metadata Formats
Metadata come in different formats. We will discuss three of those in this tutorial:
-
Ecological Metadata Language (EML): A standardized metadata format stored
in
xmlformat which is machine readable. Metadata has some standards however it's common to encounter metadata stored differently in EML files created by different organizations. - Text file: Sometimes metadata files can be found in text files that are either downloaded with a data product OR that are available separately for the data.
- Directly on a website (HTML / XML): Sometimes data are documented directly in text format, on a web page.
Metadata Stored on a Web Page
The metadata for the data that we are working with for the Harvard Forest field
site are stored in both EML format and on a web page. Let's explore the web
page first.
Let's begin by visiting that page above. At the top of the page, there is a list of data available for Harvard Forest. NOTE: hf001-06: daily (metric) since 2001 (preview) is the data that we used in the previous tutorial.
Scroll down to the Overview section on the website. Take note of the information provided in that section and answer the questions in the Challenge below.
Explore the metadata stored on the Harvard Forest LTER web page. Answer the following questions.
- What is the time span of the data available for this site?
- You have some questions about these data. Who is the lead investigator / who do you contact for more information? And how do you contact them?
- Where is this field site located? How is the site location information stored in the metadata? Is there any information that may be useful to you viewing the location? HINT: What if you were not familiar with Harvard as a site / from another country, etc?
- Field Site Information: What is the elevation for the site? What is the dominant vegetation cover for the site? HINT: Is dominant vegetation easy to find in the metadata?
- How is snow dealt with in the precipitation data?
- Are there some metadata attributes that might be useful to access in a script
in R or
Pythonrather than viewed on a web page? HINT: Can you answer all of the questions above from the information provided on this website? Is there additional information that you might want to find on the page?
View Metadata For Metrics of Interest
For this tutorial series, we are interested in the drivers of plant phenology - specifically air and soil temperature, precipitation and photosynthetically active radiation (PAR). Let's look for descriptions of these variables in the metadata and determine several key attributes that we will need prior to working with the data.
View the metadata at the URL above. Answer the following questions about the Harvard Forest LTER data - hf001-10: 15-minute (metric) since 2005:
- What is the column heading name where each variable (air temperature, soil temperature, precipitation and PAR) is stored?
- What are the units that each variable are stored in?
- What is the frequency of measurement collected for each and how are noData values stored?
- Where is the date information stored (in what field) and what timezone are the dates stored in?
Why Metadata on a Web Page Is Not Ideal
It is nice to have a web page that displays metadata information, however accessing metadata on a web page is difficult:
- If the web page URL changes or the site goes down, the information is lost.
- It's also more challenging to access metadata in text format on a web page programatically - like using R as an interface - which we often want to do when working with larger datasets.
A machine readable metadata file is better - especially when we are working with large data and we want to automate and carefully document workflows. The Ecological Metadata Language (EML) is one machine readable metadata format.
Ecological Metadata Language (EML)
While much of the documentation that we need to work with at the Harvard Forest
field site is available directly on the
,
the website also offers metadata in EML format.
Introduction to EML
The Ecological Metadata Language (EML) is a data specification developed
specifically
to document ecological data. An EML file is created using a XML based format.
This means that content is embedded within hierarchical tags. For example,
the title of a dataset might be embedded in a <title> tag as follows:
<title>Fisher Meteorological Station at Harvard Forest since 2001</title>
Similarly, the creator of a dataset is also be found in a hierarchical tag structure.
<creator>
  <individualName>
    <givenName>Emery</givenName>
    <surName>Boose</surName>
  </individualName>
</creator>
The EML package for R is designed to read and allow users to work with EML
formatted metadata. In this tutorial, we demonstrate how we can use EML in an
automated workflow.
NOTE: The EML package is still being developed, therefore we will not
explicitly teach all details of how to use it. Instead, we will provide
an example of how you can access EML files programmatically and background
information so that you can further explore EML and the EML package if you
need to work with it further.
EML Terminology
Let's first discuss some basic EML terminology. In the context of EML, each EML file documents a dataset. This dataset may consist of one or more files that contain the data in data tables. In the case of our tabular meteorology data, the structure of our EML file includes:
- The dataset. A dataset may contain one or more data tables associated with it that may contain different types of related information. For this Harvard Forest meteorological data, the data tables contain tower measurements including precipitation and temperature, that are aggregated at various time intervals (15 minute, daily, etc) and that date back to 2001.
- The data tables. Data tables refer to the actual data that make up the dataset. For the Harvard Forest data, each data table contains a suite of meteorological metrics, including precipitation and temperature (and associated quality flags), that are aggregated at a particular time interval (e.g. one data table contains monthly average data, another contains 15 minute averaged data, etc).
Work With EML in R
To begin, we will load the EML package directly from ROpenSci's Git repository.
# install R EML tool
# load devtools (if you need to install "EML")
#library("devtools")
# IF YOU HAVE NOT DONE SO ALREADY: install EML from github -- package in
# development; not on CRAN
#install_github("ropensci/EML", build=FALSE, dependencies=c("DEPENDS", "IMPORTS"))

# load ROpenSci EML package
library(EML)
# load ggmap for mapping
library(ggmap)
# load tmaptools for mapping
library(tmaptools)
Next, we will read in the LTER EML file - directly from the online URL using
eml_read. This file documents multiple data products that can be downloaded.
Check out the
for more on this dataset and to download the archive files directly.
Note that because this EML file is large, it takes a few seconds for the file to load.
# data location
# http://harvardforest.fas.harvard.edu:8080/exist/apps/datasets/showData.html?id=hf001
# table 4 http://harvardforest.fas.harvard.edu/data/p00/hf001/hf001-04-monthly-m.csv

# import EML from Harvard Forest Met Data
# note, for this particular tutorial, we will work with an abridged version of the file
# that you can access directly on the harvard forest website. (see comment below)
eml_HARV <- read_eml("https://harvardforest1.fas.harvard.edu/sites/harvardforest.fas.harvard.edu/files/data/eml/hf001.xml")

# import a truncated version of the eml file for quicker demonstration
# eml_HARV <- read_eml("http://neonscience.github.io/NEON-R-Tabular-Time-Series/hf001-revised.xml")

# view size of object
object.size(eml_HARV)

## 1299568 bytes

# view the object class
class(eml_HARV)

## [1] "emld" "list"
The eml_read function creates an EML class object. This object can be
accessed using slots in R ($) rather than a typical subset [] approach.
Explore Metadata Attributes
We can begin to explore the contents of our EML file and associated data that it
describes. Let's start at the dataset level. We can use slots to view
the contact information for the dataset and a description of the methods.
# view the contact name listed in the file

eml_HARV$dataset$creator

## $individualName
## $individualName$givenName
## [1] "Emery"
##
## $individualName$surName
## [1] "Boose"

# view information about the methods used to collect the data as described in EML
eml_HARV$dataset$methods

## $methodStep
## $methodStep$description
## $methodStep$description$section
## $methodStep$description$section[[1]]
## [1] "<title>Observation periods</title><para>15-minute: 15 minutes, ending with given time. Hourly: 1 hour, ending with given time. Daily: 1 day, midnight to midnight. All times are Eastern Standard Time.</para>"
##
## $methodStep$description$section[[2]]
## [1] "<title>Instruments</title><para>Air temperature and relative humidity: Vaisala HMP45C (2.2m above ground). Precipitation: Met One 385 heated rain gage (top of gage 1.6m above ground). Global solar radiation: Licor LI200X pyranometer (2.7m above ground). PAR radiation: Licor LI190SB quantum sensor (2.7m above ground). Net radiation: Kipp and Zonen NR-LITE net radiometer (5.0m above ground). Barometric pressure: Vaisala CS105 barometer. Wind speed and direction: R.M. Young 05103 wind monitor (10m above ground). Soil temperature: Campbell 107 temperature probe (10cm below ground). Data logger: Campbell Scientific CR10X.</para>"
##
## $methodStep$description$section[[3]]
## [1] "<title>Instrument and flag notes</title><para>Air temperature. Daily air temperature is estimated from other stations as needed to complete record.</para><para>Precipitation. Daily precipitation is estimated from other stations as needed to complete record. Delayed melting of snow and ice (caused by problems with rain gage heater or heavy precipitation) is noted in log - daily values are corrected if necessary but 15-minute values are not.  The gage may underestimate actual precipitation under windy or cold conditions.</para><para>Radiation. Whenever possible, snow and ice are removed from radiation instruments after precipitation events.  Depth of snow or ice on instruments and time of removal are noted in log, but values are not corrected or flagged.</para><para>Wind speed and direction. During ice storms, values are flagged as questionable when there is evidence (from direct observation or the 15-minute record) that ice accumulation may have affected the instrument's operation.</para>"
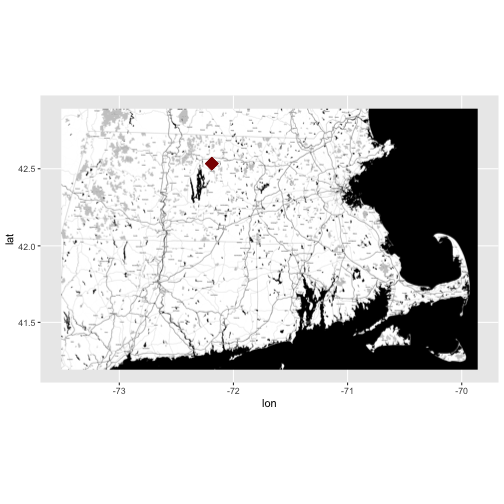
Identify & Map Data Location
Looking at the coverage for our data, there is only one unique x and y value.
This suggests that our data were collected at (x,y) one point location. We know
this is a tower so a point location makes sense. Let's grab the x and y
coordinates and create a quick context map. We will use ggmap to create our
map.
NOTE: If this were a rectangular extent, we'd want the bounding box not just the point. This is important if the data in raster, HDF5, or a similar format. We need the extent to properly geolocate and process the data.
# grab x coordinate from the coverage information
XCoord <- eml_HARV$dataset$coverage$geographicCoverage$boundingCoordinates$westBoundingCoordinate[[1]]
# grab y coordinate from the coverage information
YCoord <- eml_HARV$dataset$coverage$geographicCoverage$boundingCoordinates$northBoundingCoordinate[[1]]
# make a map and add the xy coordinates to it
ggmap(get_stamenmap(rbind(as.numeric(paste(geocode_OSM("Massachusetts")$bbox))), zoom = 11, maptype=c("toner")), extent=TRUE) + geom_point(aes(x=as.numeric(XCoord),y=as.numeric(YCoord)),
             color="darkred", size=6, pch=18)
- Learn more about ggmap:
The above example, demonstrated how we can extract information from an EML
document and use it programatically in R! This is just the beginning of what
we can do!
Metadata For Your Own Data
Now, imagine that you are working with someone else's data and you don't have a metadata file associated with it? How do you know what units the data were in? How the data were collected? The location that the data covers? It is equally important to create metadata for your own data, to make your data more efficiently "shareable".